Address the Visibility Gap: Clockwork Fleet Audit,
Fleet Monitoring and Workload Monitoring
Correlate network health to job performance with nanosecond-accurate telemetry
Deploy a reproducible, known good baseline fleet to run AI workloads
Keep the fleet healthy, performant and cost-effective while AI jobs run
Full-stack visibility and validation for efficient, resilient AI fleets
From cluster readiness to job performance, maximize your GPU return on investment

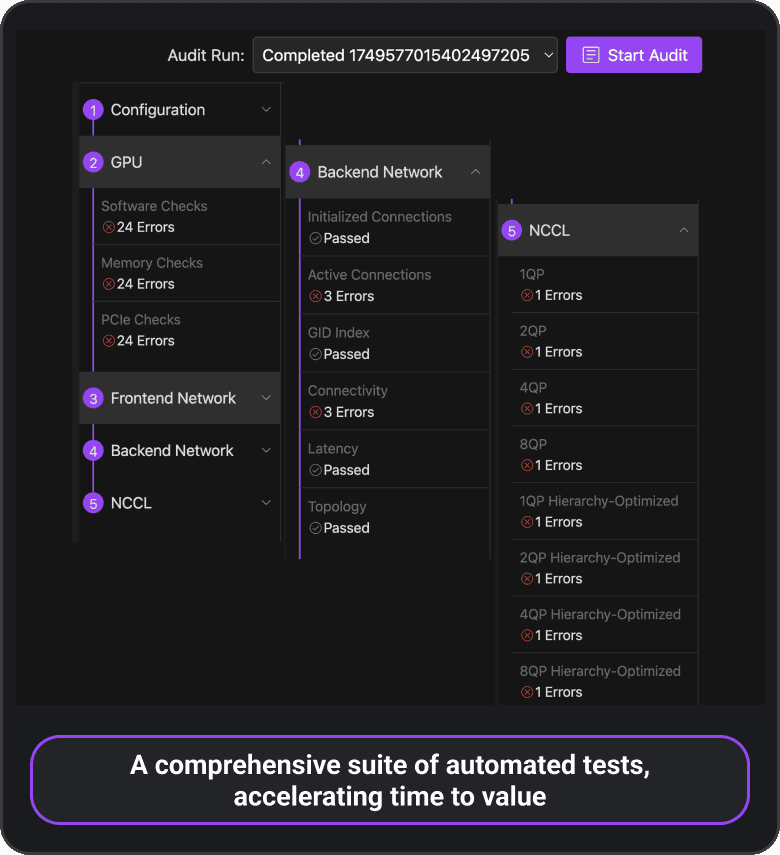
Fleet Audit
Clockwork Fleet Audit runs pre-flight and run-time checks across software, nodes, NCCL, cabling, and networks—catching issues early and continuously validating health to keep clusters efficient, GPUs productive, and jobs on track.
- Software checks
- Node checks
- Front-end network
- Back-end GPU network validation
“I want to make sure my cluster is configured correctly before I run a week-long training job.”
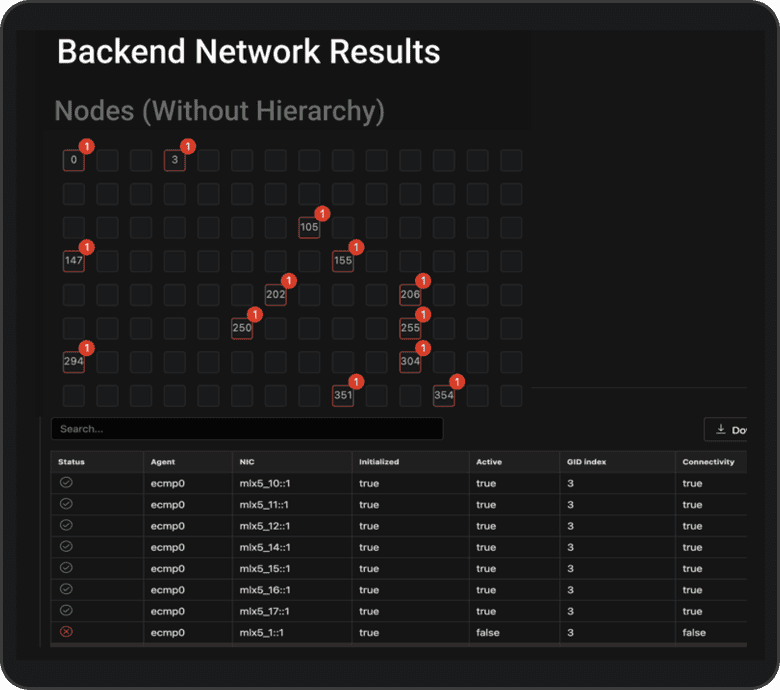
“I found (i) 3 through cabling checks; (ii) 7 through cross-cluster ping6 test; BUT (iii) 3 are unique that I would not have found!”

Fleet Monitoring
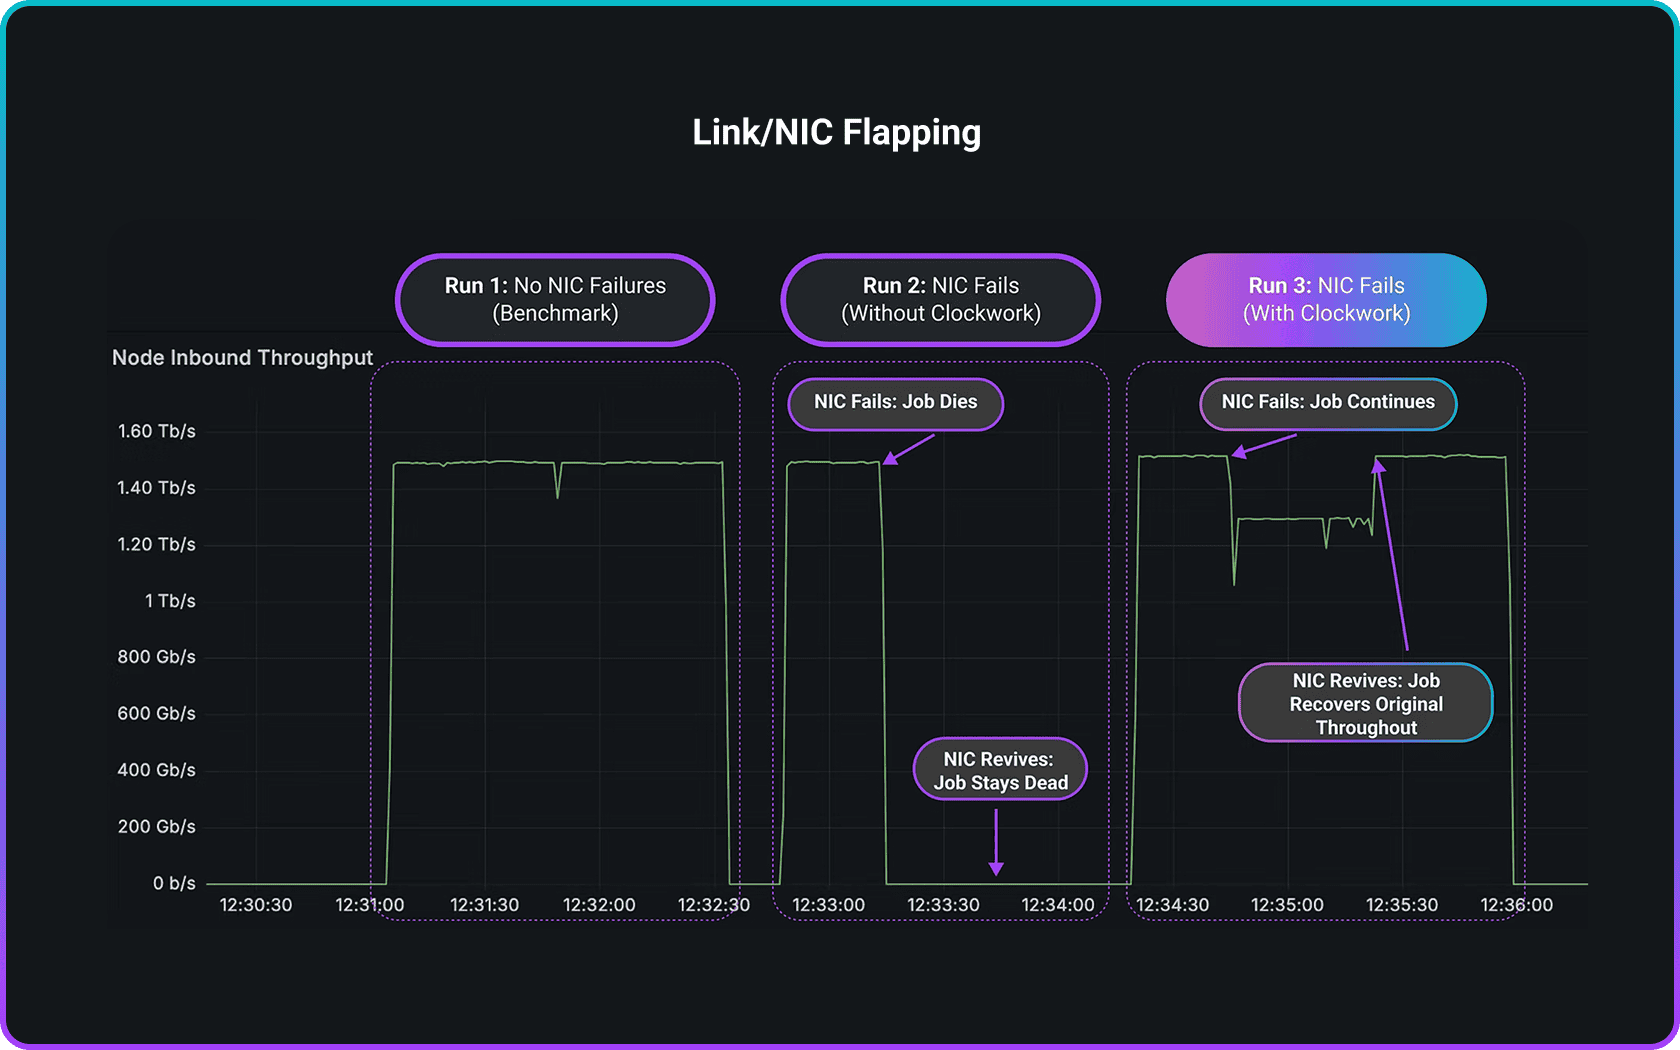
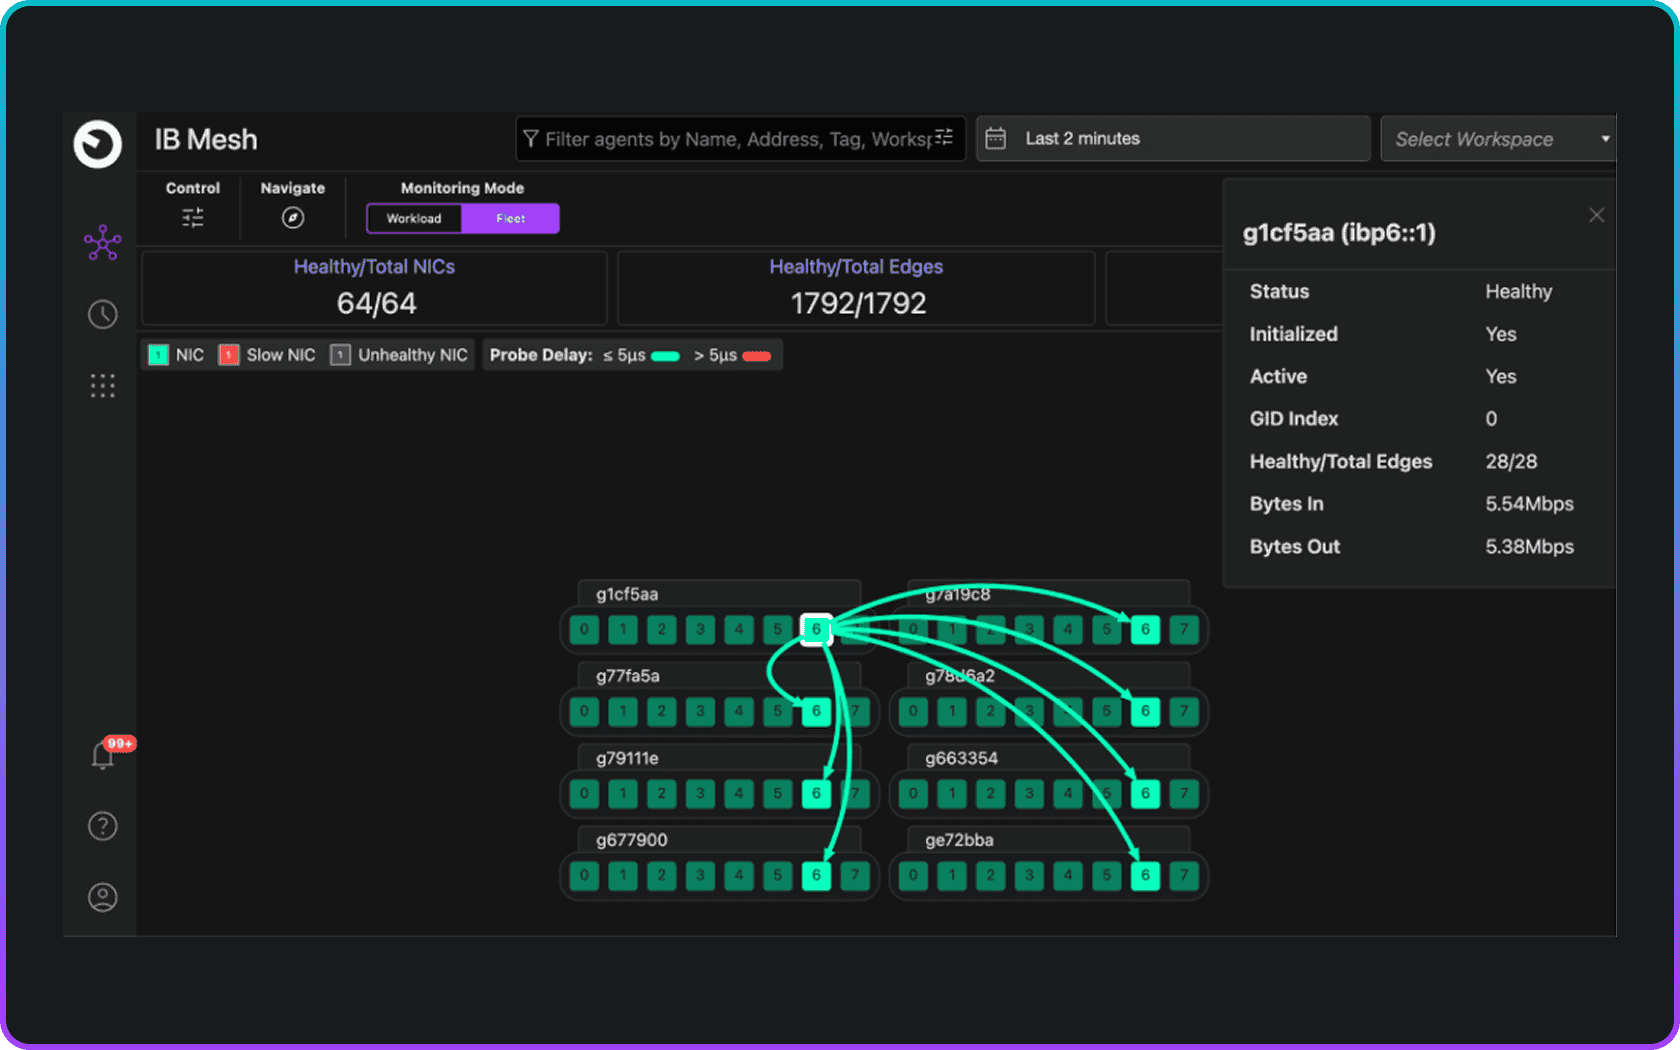
Clockwork Fleet Monitoring provides always-on visibility across clusters and fabrics. By detecting link failures, topology shifts, and congestion in real time, it keeps GPUs fully utilized and AI jobs running without disruption.
- Runtime link failures/flaps
- Runtime fabric topology
- Runtime fabric performance
- Congestion and contention monitoring
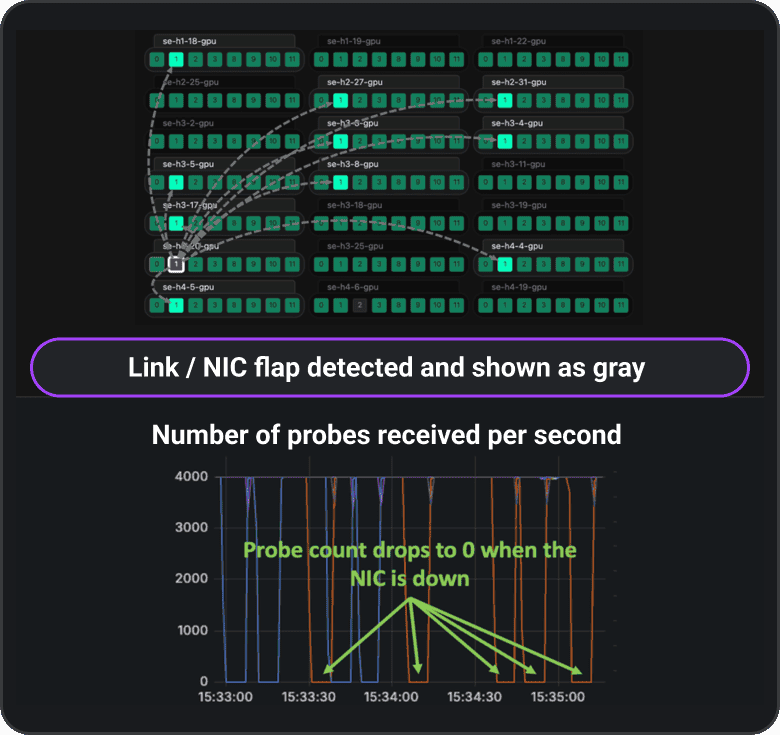
“We want to detect network failures/link flap as soon as they happen, and not when our jobs stall!”
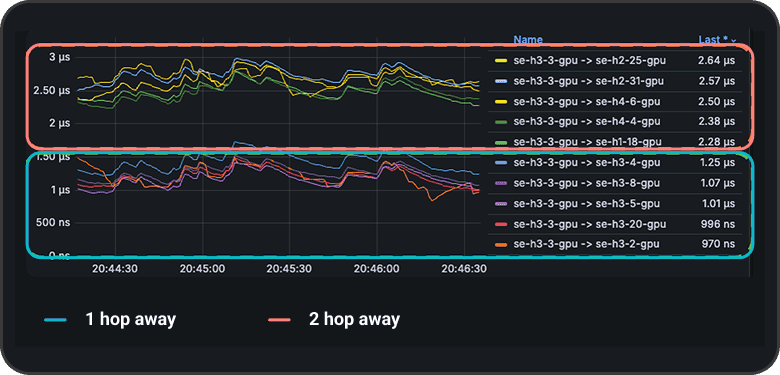
“We want to be sure that replacement GPUs in the cloud are meeting topology/latency SLAs?”
“We’d like to track latency continuously and get alerted when it goes above our set thresholds.”

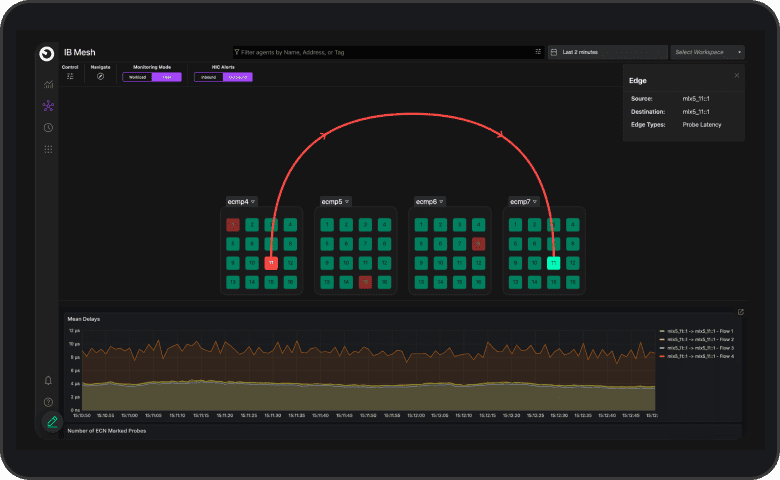
Workload Monitoring
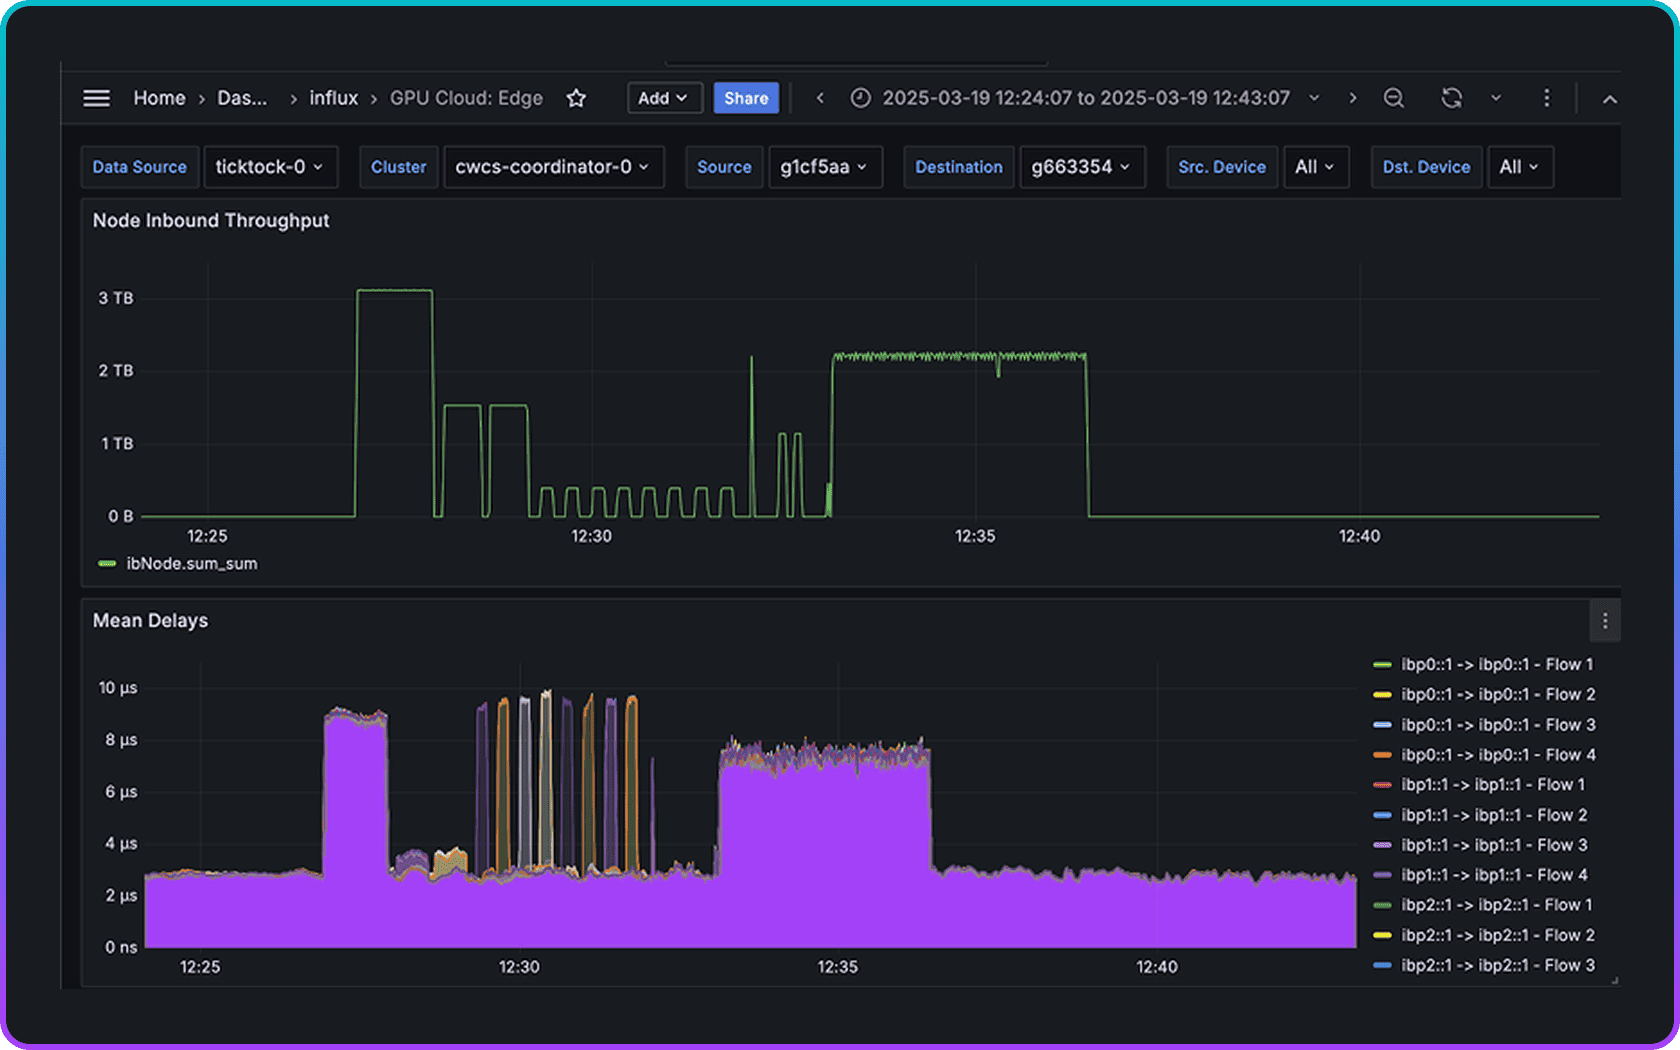
Clockwork Workload Monitoring embeds in-band telemetry into live AI jobs, correlating network performance with job behavior. It pinpoints root causes of slowdowns, enabling faster troubleshooting, fewer restarts, and consistently higher job throughput.
- Deep workload visibility
- Correlation of data path performance with network metrics to identify root cause of job performance
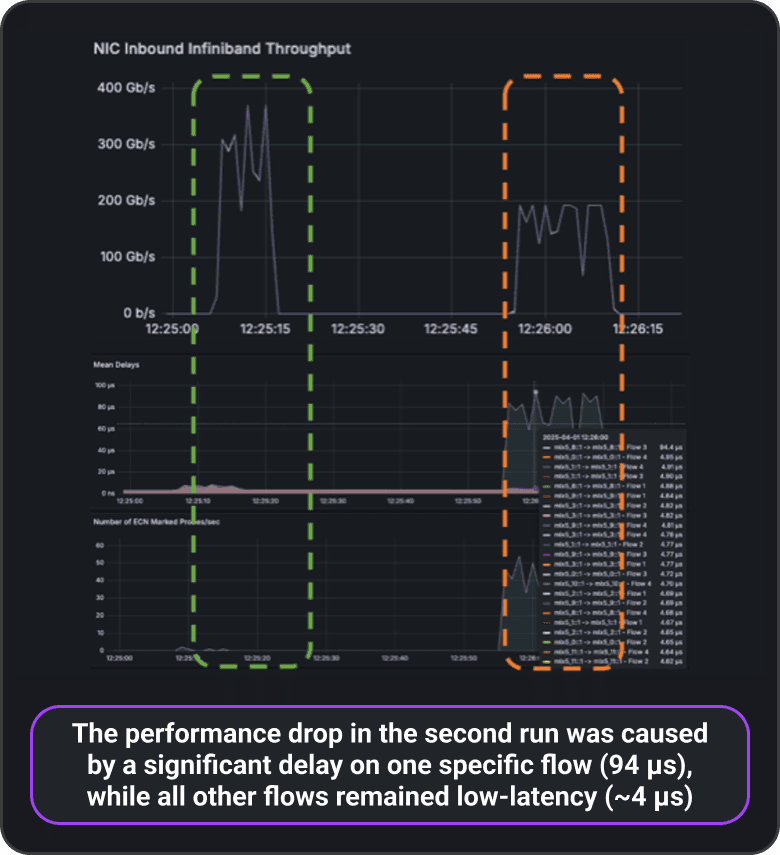
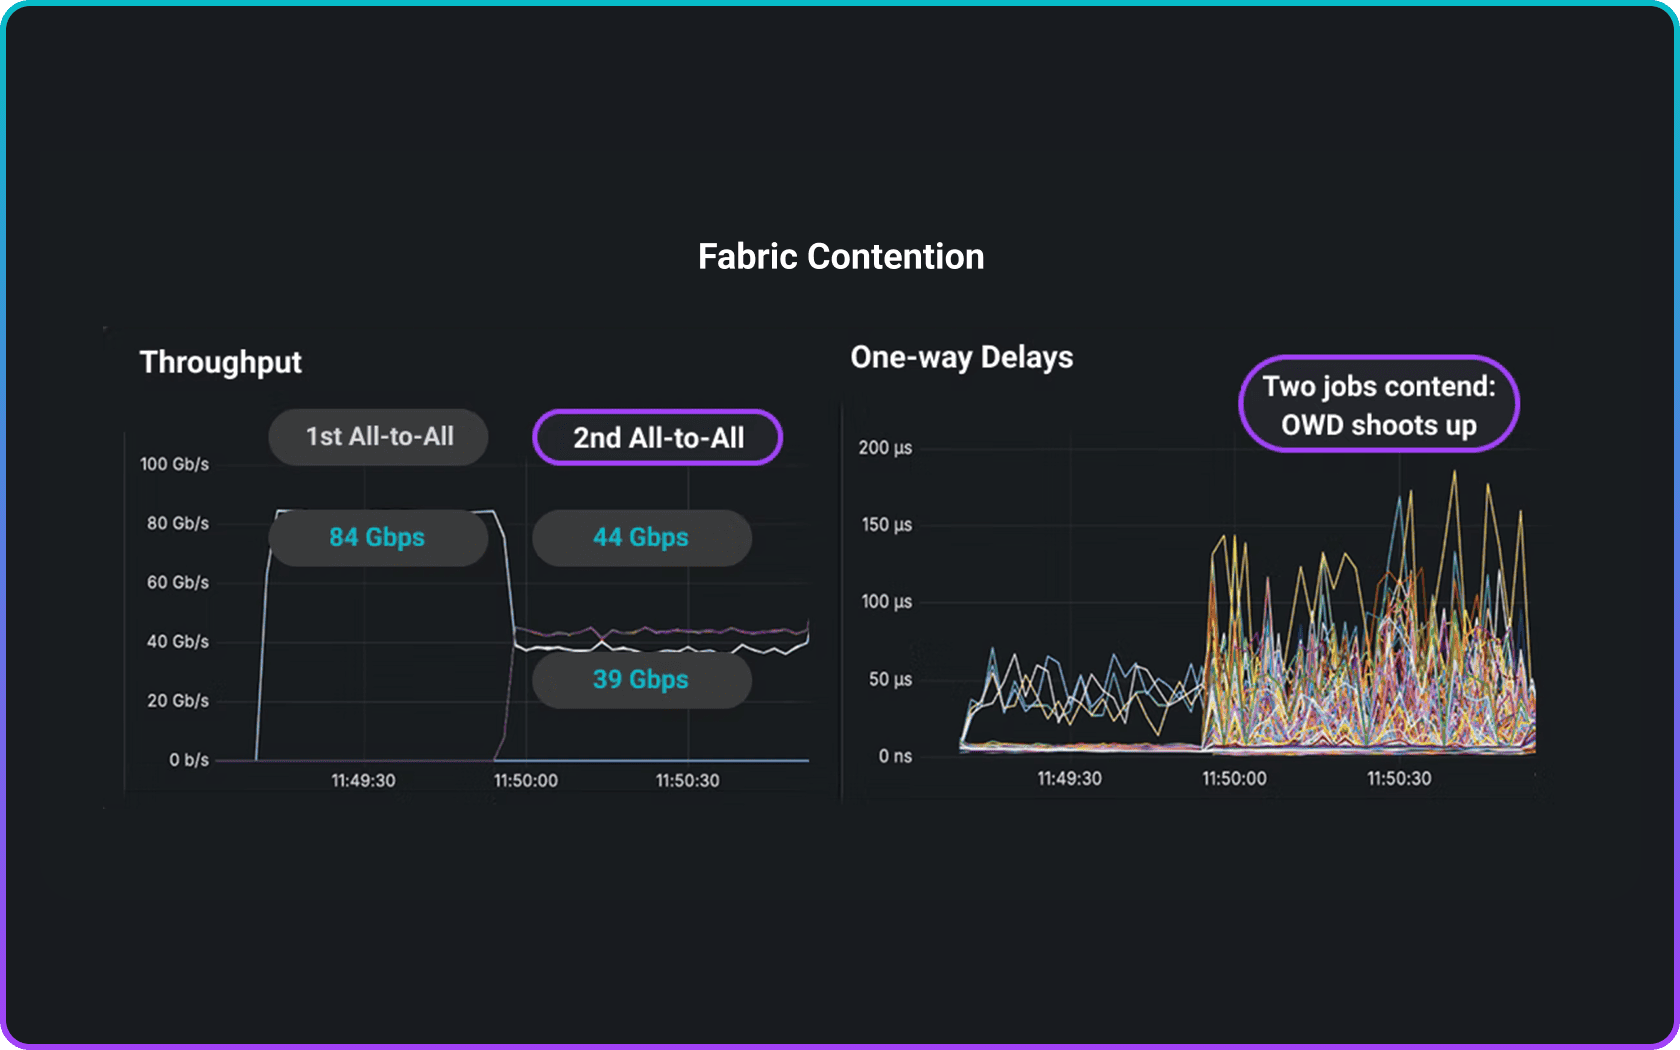
“I ran all_reduce_perf workload twice, 1st run ~360Gbps, 2nd run only ~190Gbps. What could be the problem?”
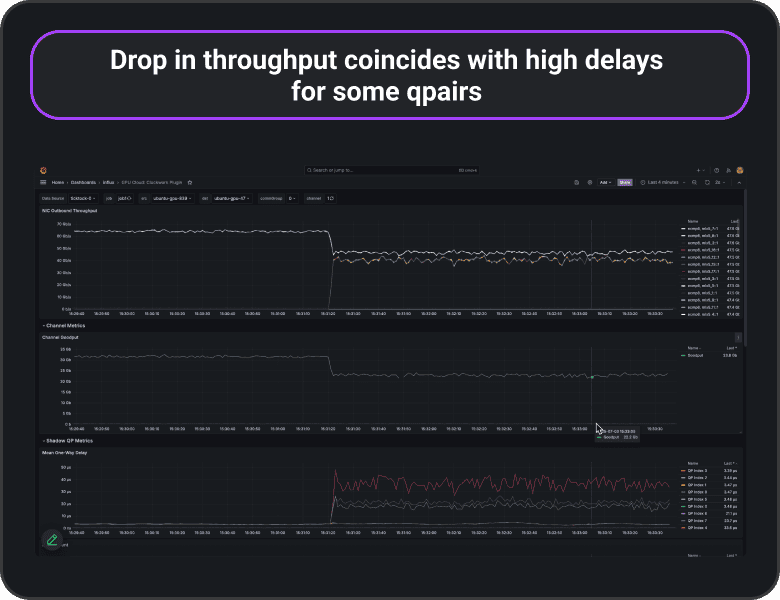
“We saw a sudden slowdown in job performance, could it be network-related?”
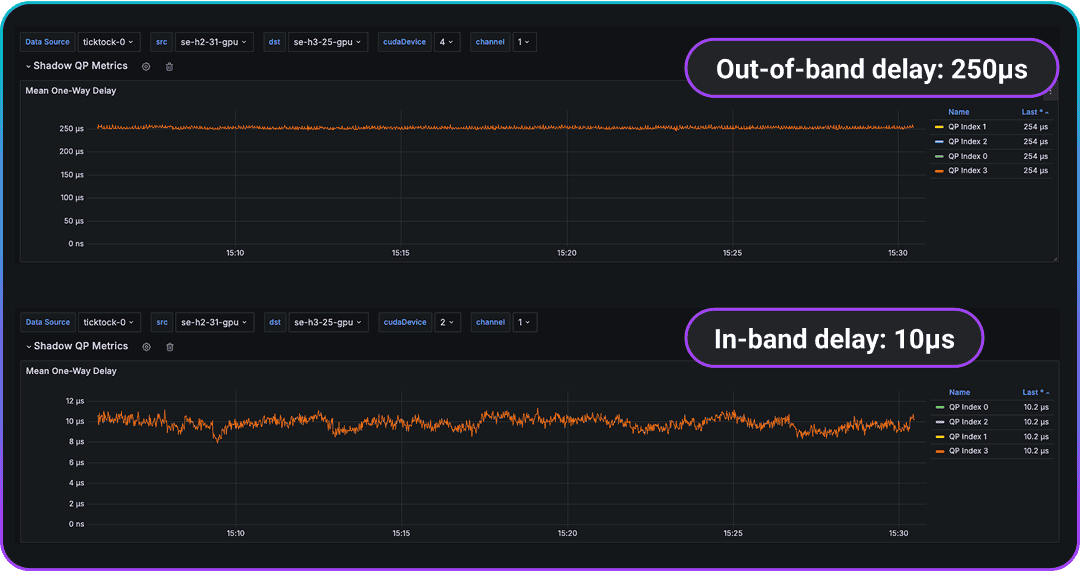
Why High Precision Attribution Matters
Pinpoint root causes with nanosecond accuracy
Out-of-band and in-band Qpair one-way-delays are very different. The workload was mistakenly configured to use RoCEv1 instead of RoCEv2.
AI clusters are complex and sensitive to configuration. Early warning indicators down to nanosecond accuracy transform transient issues into actionable insights—preventing wasted GPU hours and accelerating time-to-market.
Integrates Seamlessly With Your Observability Stack
Expose fleet telemetry through open APIs and familiar dashboards.
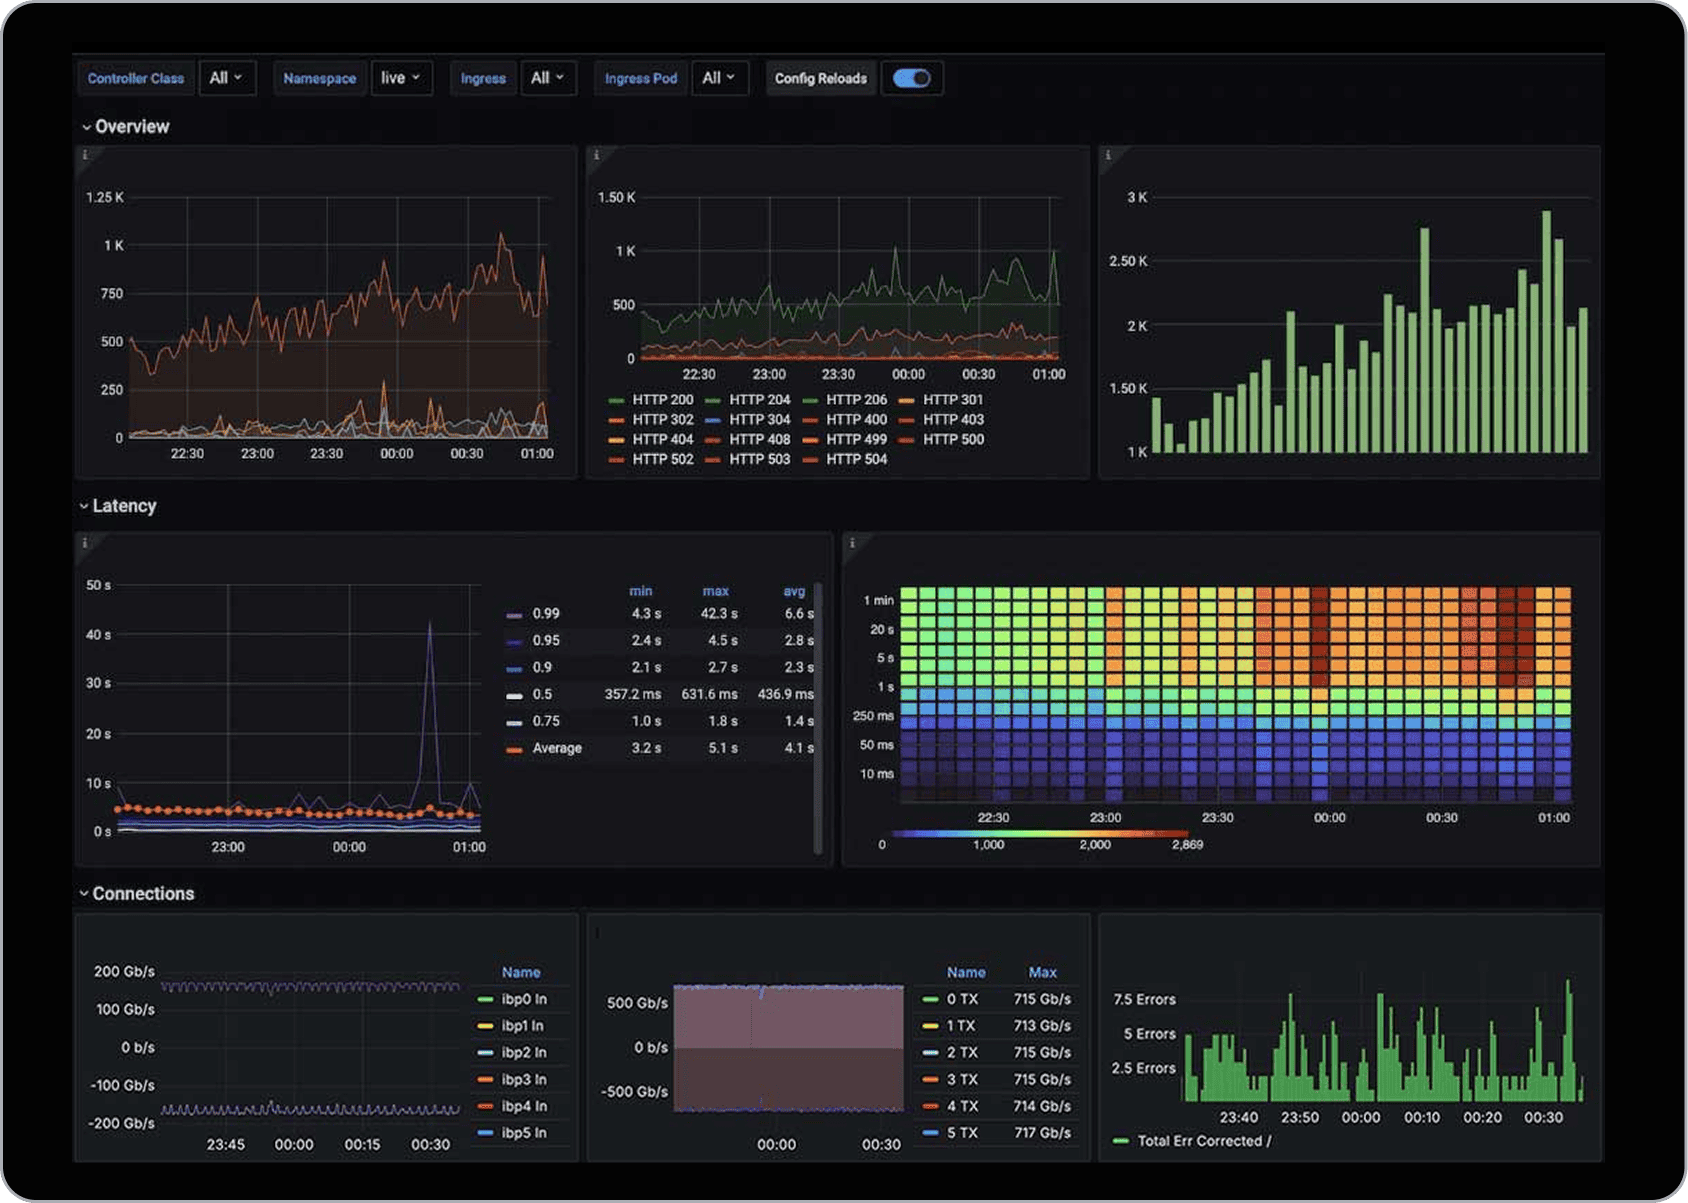
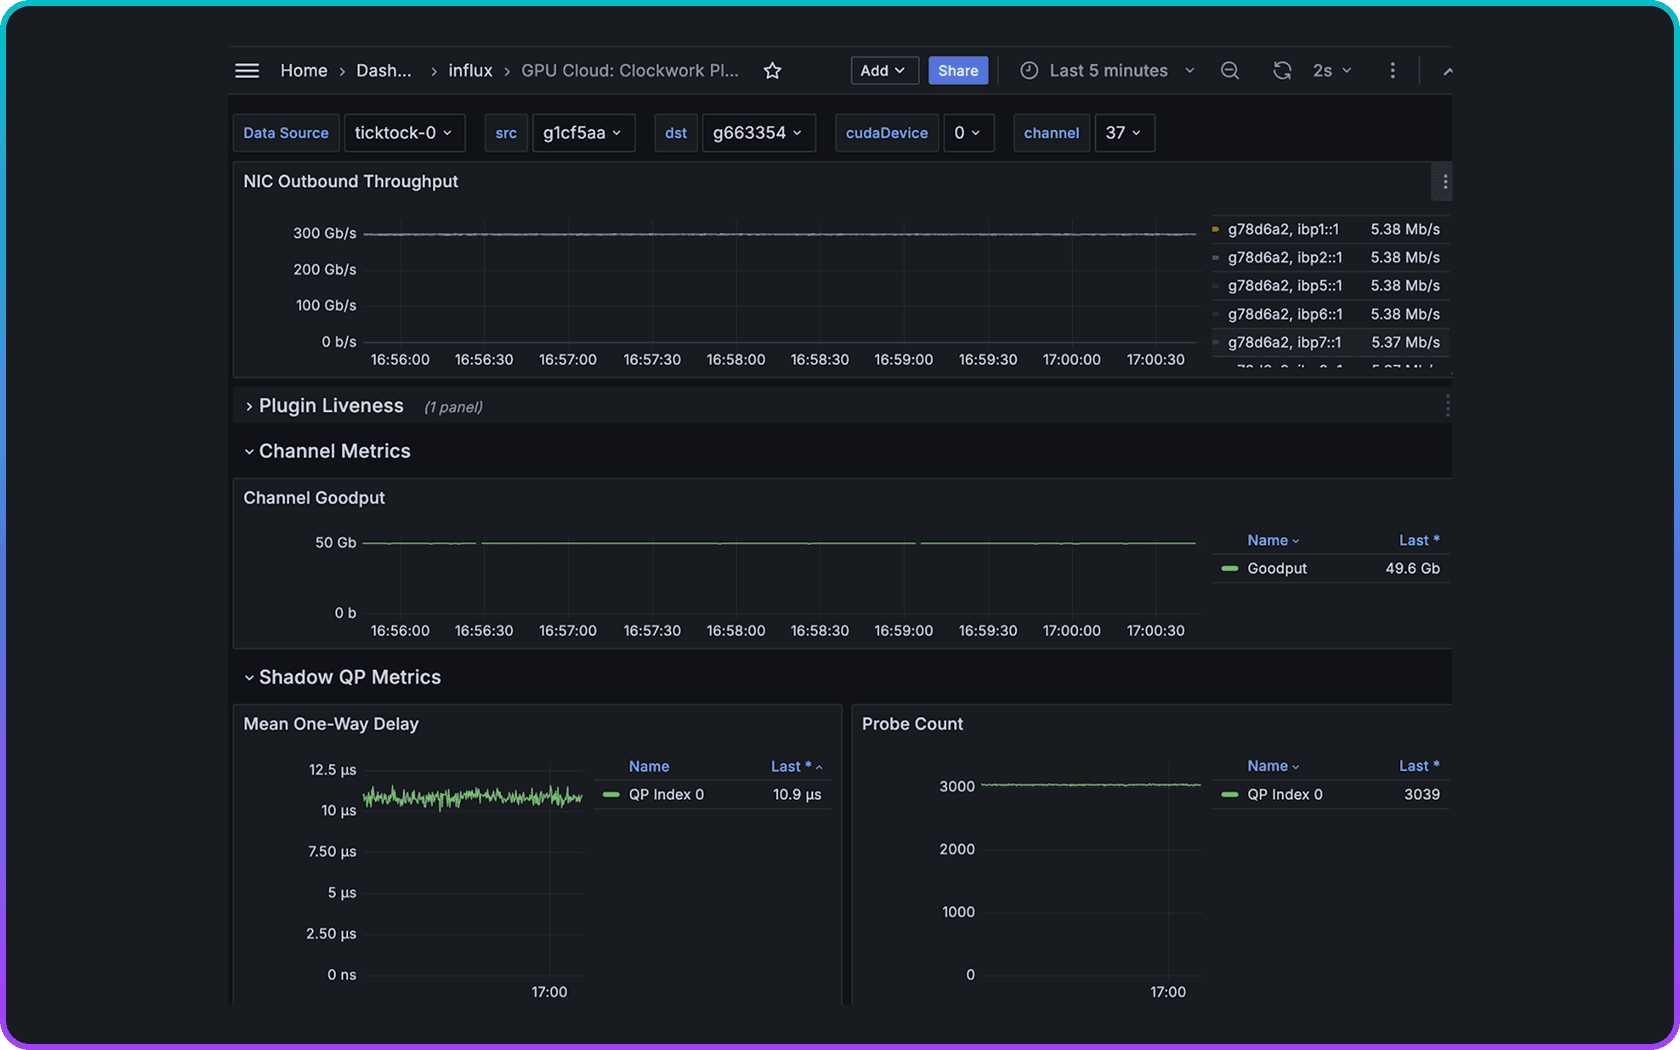
Clockwork streams cross-stack metrics via a Prometheus-compatible API, integrating directly with Grafana and existing observability tools. Operators can unify fabric, workload, and system telemetry in a single pane of glass—eliminating silos, accelerating troubleshooting, and making AI infrastructure easier to operate at scale.
Single Pane of Glass Grafana Dashboards
Nano-second Accurate Visibility and Auto-remediation
Learn More
Stop wasting GPU cycles. Start scaling smarter.
Clusters must deliver high uptime while running at maximum efficiency.
Turn your GPU clusters into a competitive advantage—not a cost center.
