The first time a team buys a serious GPU fleet, something predictable happens. Someone opens nvidia-smi, sees utilization over 95%, and reports to the CFO that the multi-million-dollar investment is earning its keep.
Then the quarterly bill lands. And it rivals the GDP of a small island nation. The real question is where all that money went.
The problem is that nvidia-smi answers a narrow, specific question: did the GPU execute any work in the last sampling window? It does not answer the larger question: did we get useful, model-advancing progress for every dollar we spent?
Here’s a concrete gut-punch: a 128-GPU H100 cluster running at 30% utilization burns roughly $1.6M/year in wasted capacity at typical reserved rates (128 × 8,760 hours × 70% idle × $2/GPU-hour). That’s not a “performance” problem. That’s an economic problem wearing a technical mask.
Across the industry, organizations typically convert only 20–25% of paid GPU capacity into useful work. To understand why, you must dismantle the monolithic idea of “utilization” and rebuild it as three distinct layers, each mapping to a different team, a different set of levers, and a different part of the budget that is silently draining away.
The Three Layers of GPU Efficiency
The following three layers disaggregate overall GPU utilization into building blocks.
Layer 1: GPU Allocation Utilization (GAU)
Of all the GPU-hours you paid for, what fraction actually had a workload running on them?
Nothing else in this framework matters if the GPU is not even assigned to a job. You can have the most beautifully optimized training code in the world, but if the GPU spends a third of its life in an empty queue or sitting in a “zombie” state because a Jupyter notebook was left open over the weekend , that optimization is irrelevant. GAU is the first gate every GPU-hour must pass through.
In the State of AI Infrastructure at Scale 2024 survey, 68% of respondents reported GPU resource usage of 70% or less even at peak demand. For reasonably disciplined organizations, GAU typically falls between 65% and 85%.
Layer 2: Effective Compute Time Ratio (ECTR)
Of the time a GPU is allocated, what fraction is it actually computing, as opposed to waiting for data, waiting for other GPUs, writing checkpoints, or recovering from failures?
A GPU can be allocated, billed, and sitting in a job’s resource quota while spending significant time doing nothing: the data pipeline cannot feed it fast enough, it is blocked on a network message from another GPU, or it is paused during a checkpoint write. ECTR measures the gap between having a GPU and using it. We call this the “Goodput” gap.
For reasonably disciplined organizations, ECTR typically falls between 70% and 90%.
Layer 3: Effective Model FLOPs Utilization (eMFU)
Of the time the GPU is actively computing, what fraction of its theoretical peak throughput produces work that actually advances the model?
This is the deepest level of the stack. It measures the gap between the number on the spec sheet (Theoretical FLOPs) and the actual math advancing your model. Google’s PaLM achieved approximately 46% MFU. Meta’s Llama 3 405B reported 38–43%. ByteDance’s MegaScale hit 55% on a 175B model. The current industry consensus for “good” MFU sits at 35–45%, with 50%+ considered excellent.
But eMFU goes further. It discounts compute that was performed but did not advance the model—most critically, computation replayed after a failure rollback. When hardware forces a restart from the last checkpoint, every GPU-hour since that checkpoint produced zero forward progress. Real dollars burned, real electricity consumed, zero useful work.
Effective eMFU, combining MFU with progress efficiency, typically ranges from 30% to 50% of theoretical peak.
The Carpenter and the 80% Waste
Imagine you hired a world-class carpenter for eight hours.
GPU Allocation Utilization (GAU) measures whether the carpenter showed up. Effective Compute Time Ratio (ECTR) measures how much of those eight hours the carpenter actually spent swinging a hammer versus waiting for lumber deliveries or searching for tools. And Effective Model Flops Utilization (eMFU) measures how much of that hammering actually turned into finished cabinetry. Even when the hammer is swinging, the carpenter might be driving nails into plywood – using a fraction of their true craftsmanship. Worse, if a wall collapses overnight, they may have to spend two hours on Monday morning rebuilding what they’d already finished Friday.
If the carpenter showed up for 6 of the 8 hours (75% GAU), spent 4 of those 6 actually hammering (67% ECTR), and only 40% of that hammering produced forward progress at full craftsmanship (40% eMFU), you got 75% × 67% × 40% = 20% of the master carpentry you paid for.
What This Means For Your Organization
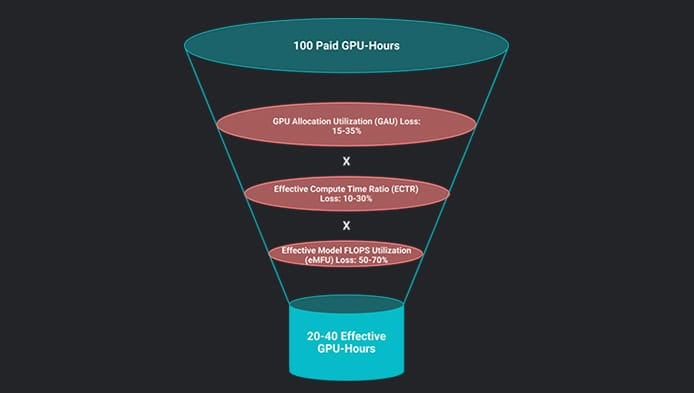
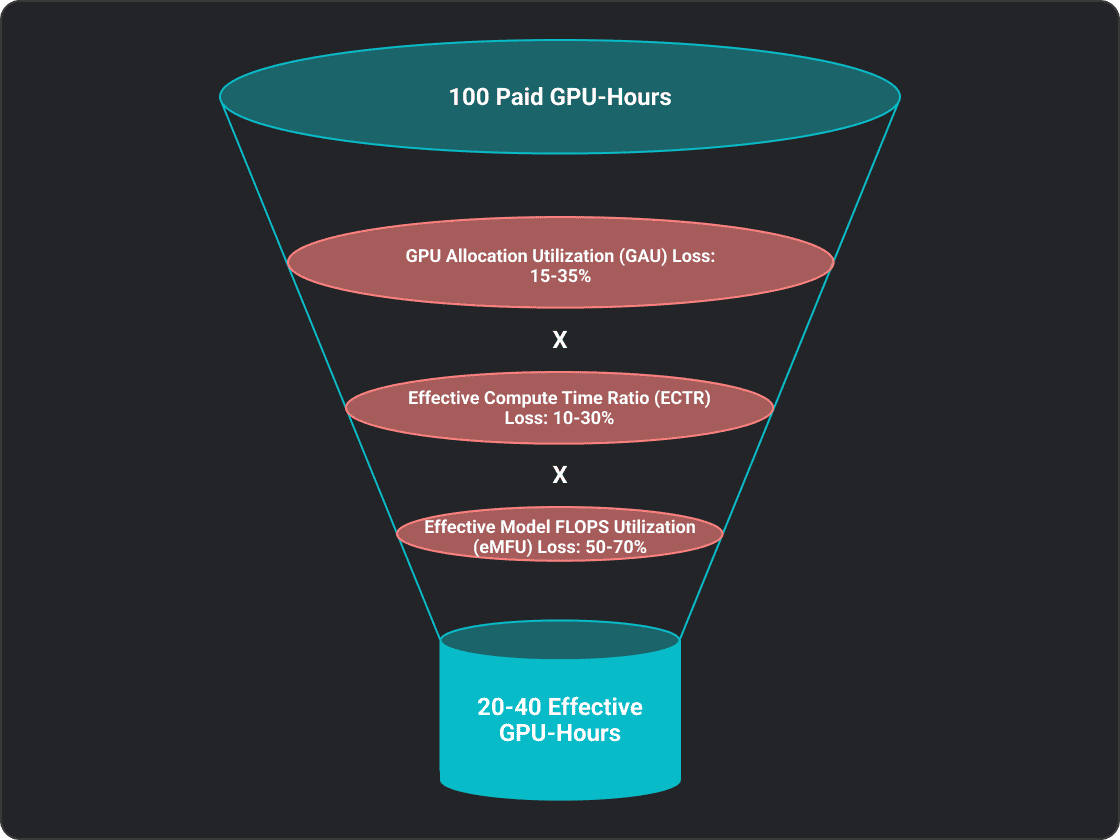
For large-scale training, GAU losses claim 15–35%, ECTR losses claim a multiplicative 10–30%, and eMFU losses claim a multiplicative 50–70%. For production inference, the profile shifts: GAU can be significantly better on elastic infrastructure or significantly worse on always-on reserved instances ranging from as high as 90% to as low as 40%; ECTR losses widen to 15–35% as prefill-decode interference and KV cache pressure replace data pipeline stalls and checkpoint pauses; and eMFU losses widen to 55–75%, dominated by the fundamental memory-bandwidth bottleneck of autoregressive decoding.
The extremes are unusual. It takes a truly world-class team to realize 55%, and a team would really be slipping if they only realized 10% of the theoretical FLOPs associated with 100 GPU-hours. The reality for most teams is somewhere between 20 and 40%.
Part 2 of this blog identifies the twelve specific leaks that drain that 60–80% and maps each one to a team, a metric, and a fix.